Results
This is the first part of the Human-vs-Bot project. Here, we simulate data to mimic plausible behavioral differences between human and bot users—focusing specifically on response timing patterns. We walk through the functions used to generate and clean the data, with the goal of producing a dataset suitable for classification modeling.
The functions we use generate synthetic user session data, but the raw output isn’t immediately ready for modeling. In this section, we explain how the simulated data is structured and describe the key steps we took to clean and prepare it for analysis.
There are four core functions in this process:
human_startTimeshuman_timesDistributionDFbot_startTimesbot_timesDistributionDF_startTimes functions create session identifiers and assign start times for each user, while the _timesDistributionDF functions simulate
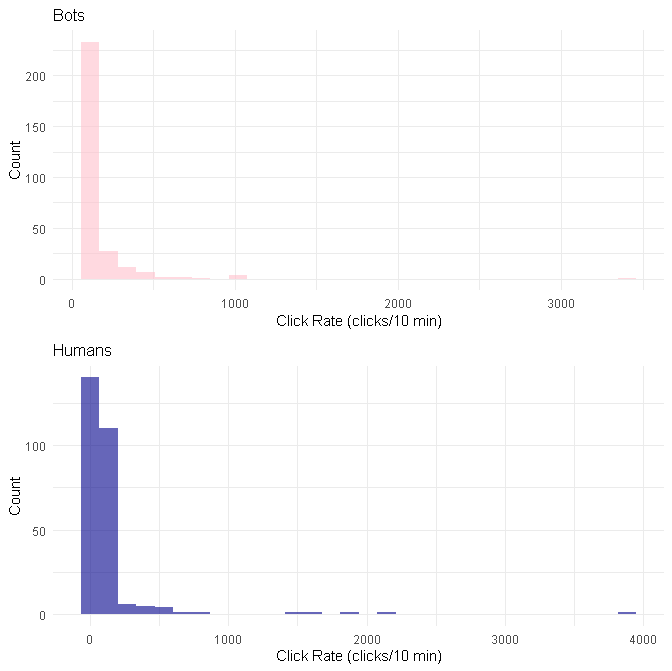
time-stamped responses. Human response intervals are drawn from a normal distribution, while bot responses follow an exponential distribution.
The _startTimes functions are structurally similar for both humans and bots. Each function assigns a unique user ID and generates session IDs based on simulated start times.
Humans are simulated with more variable and normally distributed response intervals, while bots produce faster, more consistent responses following an exponential distribution. These assumptions are deliberately simple—they are not meant to reflect real-world bot detection methods but to illustrate how even basic behavioral patterns can be used to construct predictive models.
The functions above generate data with four key columns:
idsession_idtypetimeid and session combination has multiple response time entries. The type (bot or human)
is also constant per session. From this, we derived five additional features. Four are used in classification models, and one supports
visualization. One key feature is the number of responses per session. While an earlier version referred to this as clicks_per_session,
we updated the terminology to responses to better reflect varied input behavior across users.
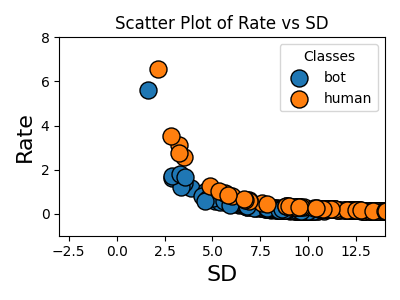
responses_per_sessiondurationraterate_10mininter_response
While earlier drafts referred to clicks_per_session, we transitioned to responses_per_session to better capture varied user input—such as
mouse movement, screen touches, or scrolling. This broader definition reflects the kind of behaviors we'd expect in realistic sessions and leaves room for richer
analysis in future iterations.
responses_per_session was determined by the number of unique times, or rows per id and session_id. duration was determined
by ordering the rows with respect to the time column and calculating the distince between the last time and first time by id and session_id. The
remaining feature calculations can be found in the R
script simulateData_andPrepUpdated.R.